
27 February 2024 Nuveen Churchill Direct Lending Corp. (NCDL) Fourth Quarter and Full Year 2023 Earnings
2Nuveen Churchill Direct Lending Corp. Disclaimer This presentation is for informational purposes only. It does not convey an offer of any type and is not intended to be, and should not be construed as, an offer to sell, or the solicitation of an offer to buy, any securities of Nuveen Churchill Direct Lending Corp. (the “Company,” “NCDLC,” “we,” “us” or “our”). Any such offering can be made only at the time an offeree receives a prospectus relating to such offering and other operative documents which contain significant details with respect to risks and should be carefully read. In addition, the information in this presentation is qualified in its entirety by reference to the more detailed discussions contained in the Company’s public filings with the Securities and Exchange Commission (the “SEC”), including without limitation, the risk factors. Nothing in this presentation constitutes investment advice. You or your clients may lose money by investing in the Company. The Company is not intended to be a complete investment program and, due to the uncertainty inherent in all investments, there can be no assurance that the Company will achieve its investment objectives. The information contained herein is not intended to provide, and should not be relied upon for, accounting, legal or tax advice or investment recommendations. Prospective investors should also seek advice from their own independent tax, accounting, financial, investment and legal advisors to properly assess the merits and risks associated with an investment in the Company in light of their own financial condition and other circumstances. These materials and the presentations of which they are a part, and the summaries contained herein, do not purport to be complete and no obligation to update or otherwise revise such information is being assumed. Nothing shall be relied upon as a promise or representation as to the future performance of the Company. Such information is qualified in its entirety by reference to the more detailed discussions contained elsewhere in the Company’s public filings with the SEC. An investment in the Company is speculative and involves a high degree of risk. There can be no guarantee that the Company’s investment objective will be achieved. The Company may engage in other investment practices that may increase the risk of investment loss. An investor could lose all or substantially all of his, her or its investment. The Company may not provide periodic valuation information to investors, and there may be delays in distributing important tax information. The Company’s fees and expenses may be considered high and, as a result, such fees and expenses may offset the Company’s profits. For a summary of certain of these and other risks, please see the Company’s public filings with the SEC. There is no guarantee that any of the estimates, targets or projections illustrated in these materials and any presentation of which they form a part will be achieved. Any references herein to any of the Company’s past or present investments or its past or present performance, have been provided for illustrative purposes only. It should not be assumed that these investments were or will be profitable or that any future investments by the Company will be profitable or will equal the performance of these investments. Diversification of an investor’s portfolio does not assure a profit or protect against loss in a declining market. Opinions expressed reflect the current opinions of Churchill as of the date appearing in the materials only and are based on Churchill’s opinions of the current market environment, which is subject to change. Certain information contained in the materials discusses general market activity, industry or sector trends, or other broad-based economic, market or political conditions and should not be construed as research or investment advice. There can be no assurances that any of the trends described herein will continue or will not reverse. Past events and trends do not imply, predict or guarantee, and are not necessarily indicative of, future events or results. This presentation includes forward-looking statements about NCDL that involve substantial risks and uncertainties. These forward-looking statements are not historical facts, but rather are based on current expectations, estimates and projections about us, our current and prospective portfolio investments, our industry, our beliefs, and our assumptions. Words such as “anticipates,” “expects,” “intends,” “plans,” “believes,” “seeks,” “estimates,” “would,” “should,” “targets,” “projects,” and variations of these words and similar expressions are intended to identify forward-looking statements. These statements are not guarantees of future performance and are subject to risks, uncertainties, and other factors, some of which are beyond our control and difficult to predict, that could cause actual results to differ materially from those expressed or forecasted in the forward-looking statements. Such factors include, but are not limited to the risks, uncertainties and other factors we identify in the section entitled “Risk Factors” in filings we make with the Securities and Exchange Commission, which are accessible on the SEC’s website at www.sec.gov. Investors should not place undue reliance on these forward-looking statements, which apply only as of the date on which NCDL makes them. NCDL does not undertake any obligation to update or revise any forward-looking statements or any other information contained herein, except as required by applicable law. We have based the forward-looking statements included in this presentation on information available to us on the date of this presentation, and we assume no obligation to update any such forward- looking statements. Should NCDL’s estimates, projections and assumptions or these other uncertainties and factors materialize in ways that NCDL did not expect, actual results could differ materially from the forward-looking statements in this presentation. All capitalized terms in the presentation have the same definitions as the Company’s Annual Report on Form 10-K for the year ended December 31, 2023. Please see Endnotes at the end of this presentation for additional important information.
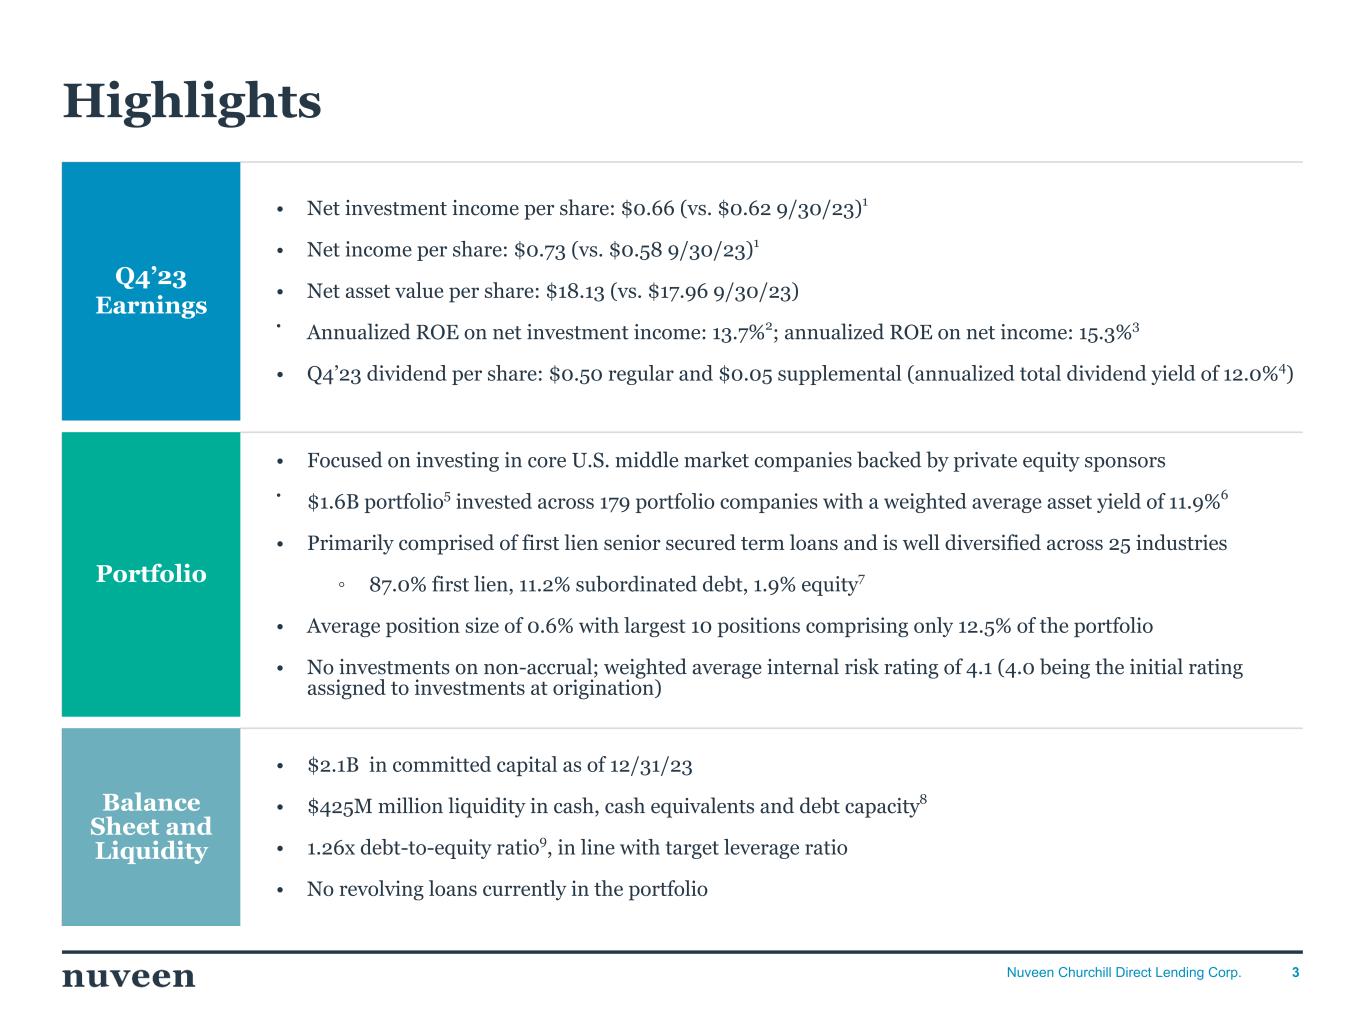
3Nuveen Churchill Direct Lending Corp. Q4’23 Earnings • Net investment income per share: $0.66 (vs. $0.62 9/30/23)1 • Net income per share: $0.73 (vs. $0.58 9/30/23)1 • Net asset value per share: $18.13 (vs. $17.96 9/30/23) • Annualized ROE on net investment income: 13.7%2; annualized ROE on net income: 15.3%3 • Q4’23 dividend per share: $0.50 regular and $0.05 supplemental (annualized total dividend yield of 12.0%4) Portfolio • Focused on investing in core U.S. middle market companies backed by private equity sponsors • $1.6B portfolio5 invested across 179 portfolio companies with a weighted average asset yield of 11.9%6 • Primarily comprised of first lien senior secured term loans and is well diversified across 25 industries ◦ 87.0% first lien, 11.2% subordinated debt, 1.9% equity7 • Average position size of 0.6% with largest 10 positions comprising only 12.5% of the portfolio • No investments on non-accrual; weighted average internal risk rating of 4.1 (4.0 being the initial rating assigned to investments at origination) Balance Sheet and Liquidity • $2.1B in committed capital as of 12/31/23 • $425M million liquidity in cash, cash equivalents and debt capacity8 • 1.26x debt-to-equity ratio9, in line with target leverage ratio • No revolving loans currently in the portfolio Highlights
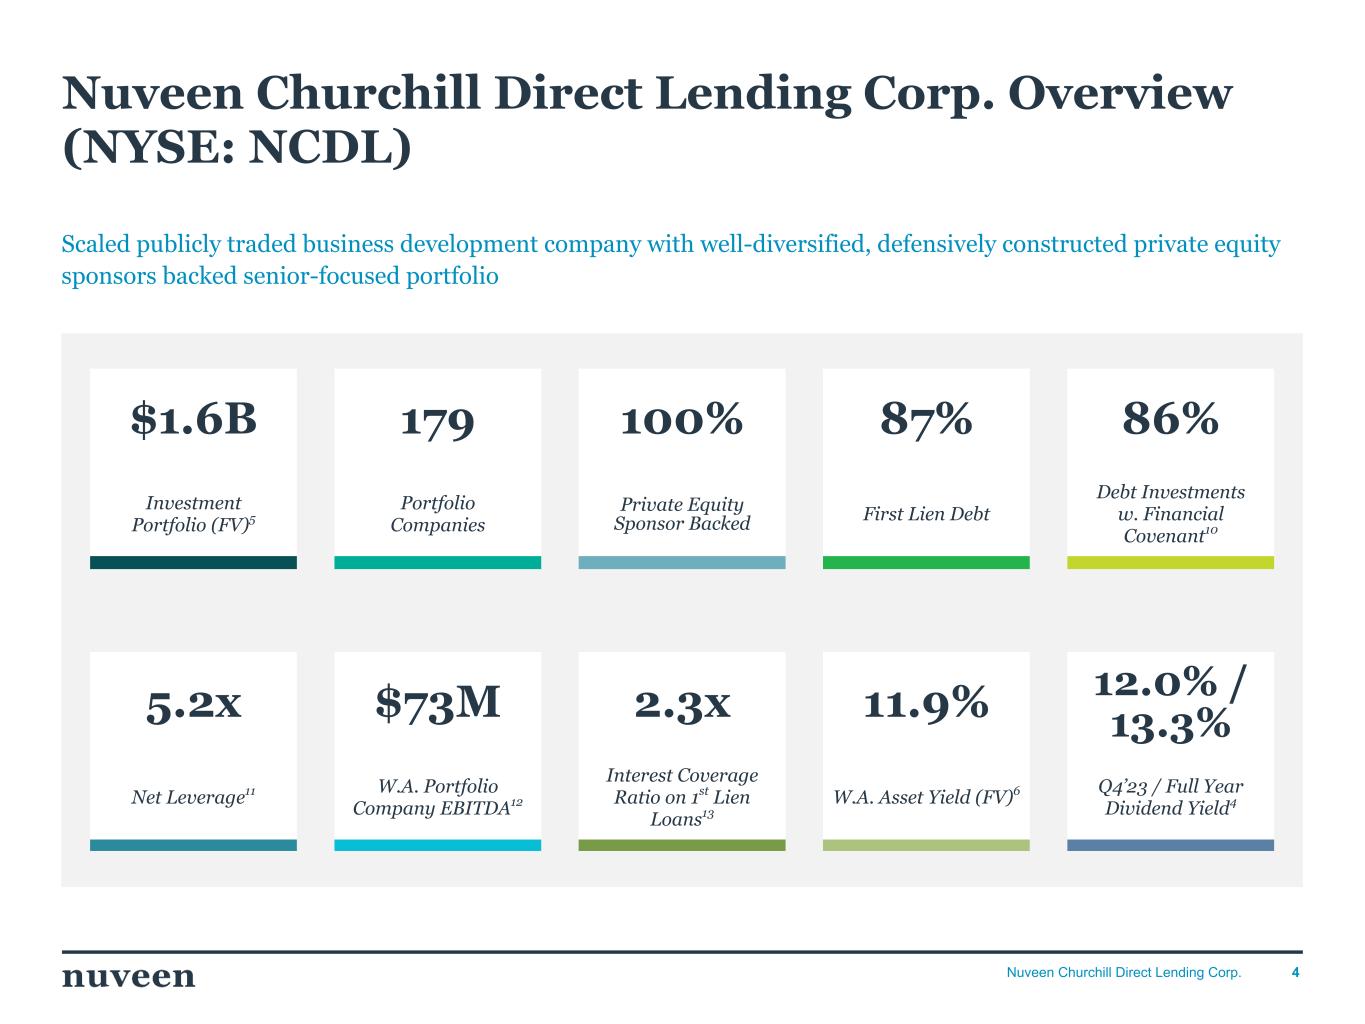
4Nuveen Churchill Direct Lending Corp. Nuveen Churchill Direct Lending Corp. Overview (NYSE: NCDL) Scaled publicly traded business development company with well-diversified, defensively constructed private equity sponsors backed senior-focused portfolio 5.2x $73M 2.3x 11.9% 12.0% / 13.3% Net Leverage11 W.A. Portfolio Company EBITDA12 Interest Coverage Ratio on 1st Lien Loans13 W.A. Asset Yield (FV)6 Q4’23 / Full Year Dividend Yield4 $1.6B 179 100% 87% 86% Investment Portfolio (FV)5 Portfolio Companies Private Equity Sponsor Backed First Lien Debt Debt Investments w. Financial Covenant10
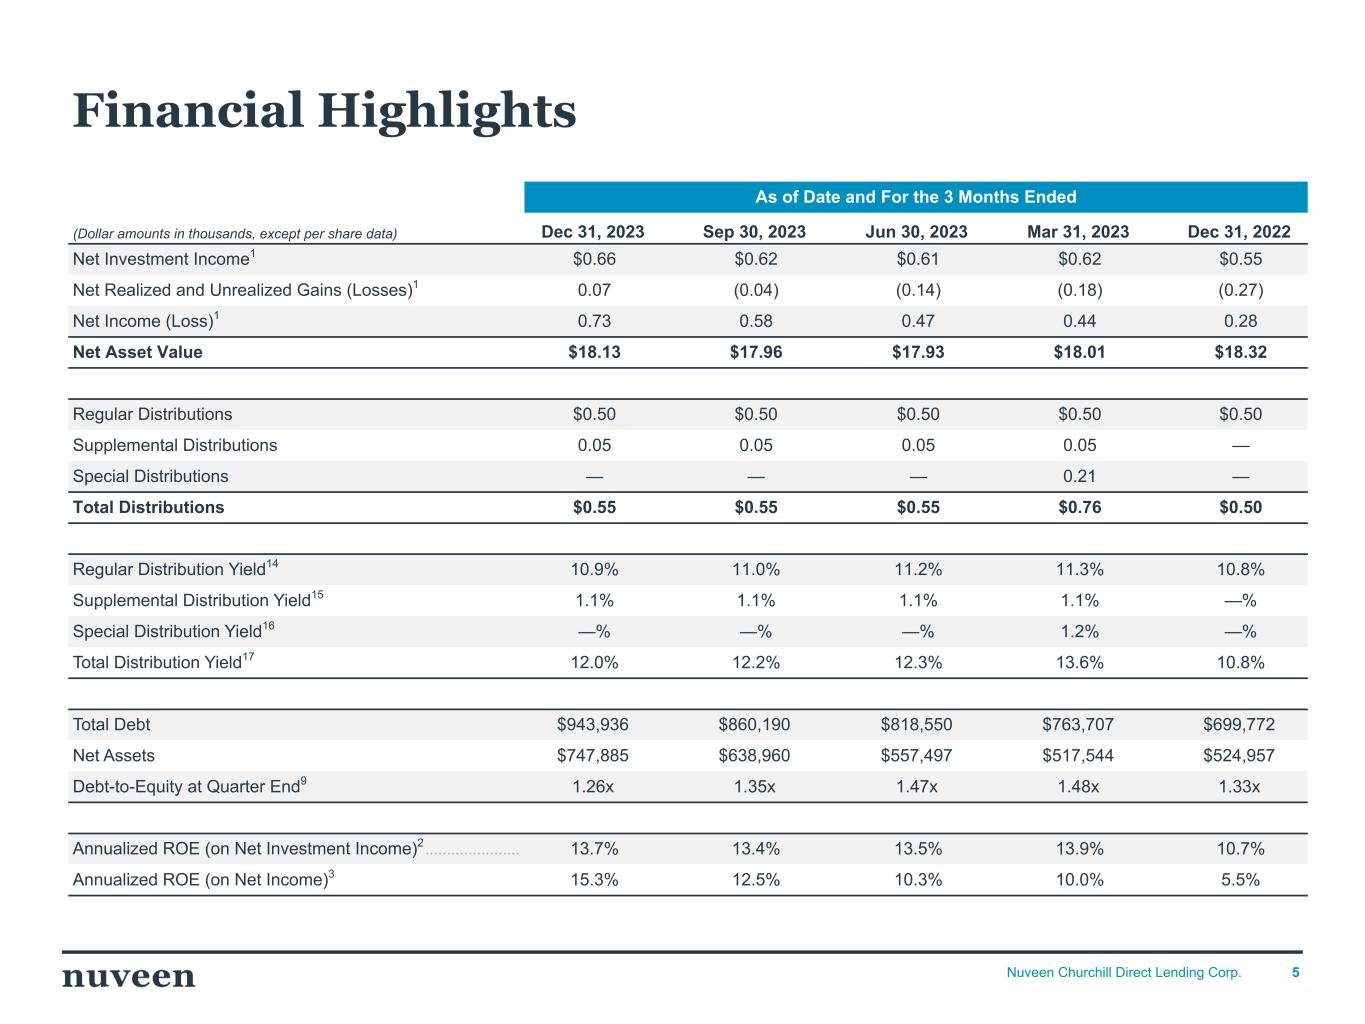
5Nuveen Churchill Direct Lending Corp. As of Date and For the 3 Months Ended (Dollar amounts in thousands, except per share data) Dec 31, 2023 Sep 30, 2023 Jun 30, 2023 Mar 31, 2023 Dec 31, 2022 Net Investment Income1 $0.66 $0.62 $0.61 $0.62 $0.55 Net Realized and Unrealized Gains (Losses)1 0.07 (0.04) (0.14) (0.18) (0.27) Net Income (Loss)1 0.73 0.58 0.47 0.44 0.28 Net Asset Value $18.13 $17.96 $17.93 $18.01 $18.32 Regular Distributions $0.50 $0.50 $0.50 $0.50 $0.50 Supplemental Distributions 0.05 0.05 0.05 0.05 — Special Distributions — — — 0.21 — Total Distributions $0.55 $0.55 $0.55 $0.76 $0.50 Regular Distribution Yield14 10.9% 11.0% 11.2% 11.3% 10.8% Supplemental Distribution Yield15 1.1% 1.1% 1.1% 1.1% —% Special Distribution Yield16 —% —% —% 1.2% —% Total Distribution Yield17 12.0% 12.2% 12.3% 13.6% 10.8% Total Debt $943,936 $860,190 $818,550 $763,707 $699,772 Net Assets $747,885 $638,960 $557,497 $517,544 $524,957 Debt-to-Equity at Quarter End9 1.26x 1.35x 1.47x 1.48x 1.33x Annualized ROE (on Net Investment Income)2 ...................... 13.7% 13.4% 13.5% 13.9% 10.7% Annualized ROE (on Net Income)3 15.3% 12.5% 10.3% 10.0% 5.5% Financial Highlights
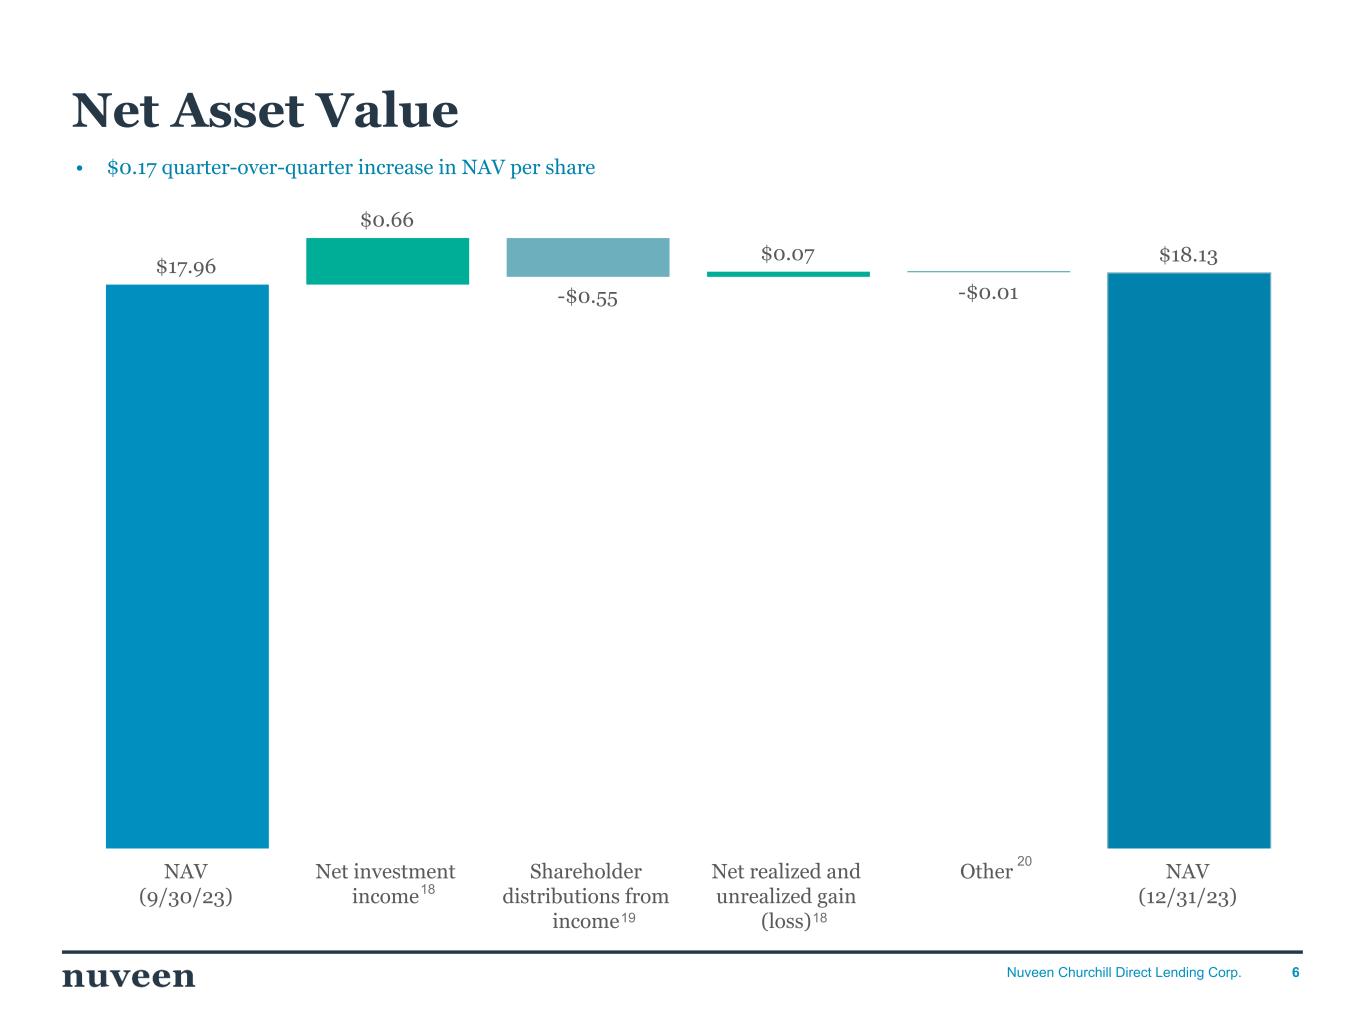
6Nuveen Churchill Direct Lending Corp. Net Asset Value $17.96 $0.66 -$0.55 $0.07 -$0.01 $18.13 NAV (9/30/23) Net investment income Shareholder distributions from income Net realized and unrealized gain (loss) Other NAV (12/31/23) 18 20 PLEASE DO NOT TOUCH THE FORMATTING (MOVE AROUND BOXES, CHANGE CHARTS ETC.) THANK YOU!!! 19 • $0.17 quarter-over-quarter increase in NAV per share 18

7Nuveen Churchill Direct Lending Corp. Dividend History As of Record Date $0.50 $0.50 $0.50 $0.50 $0.05 $0.05 $0.05 $0.05 $0.21 11.3% 11.2% 11.0% 10.9% 12.4% 12.3% 12.2% 12.0% Regular Dividend per Share ($) Supp. Dividend per share ($) Special Dividend per share ($) Regular Annualized Dividend Yield (%) Total Annualized Dividend Yield (w. Supp.) (%) 03/30/23 06/28/23 09/28/23 12/29/23 $0.20 $0.40 $0.60 $0.80 $1.00 $1.20 —% 2.5% 5.0% 7.5% 10.0% 12.5% 15.0% • Dividends have remained stable as portfolio has reached scale and interest rates remain elevated • The Company declared a total dividend of $0.55 per share (12.0%4 total annualized dividend yield) for the quarter ended on December 31, 2023 PLEASE DO NOT TOUCH THE FORMATTING (MOVE AROUND BOXES, CHANGE CHARTS ETC.) THANK YOU!!! 4 4
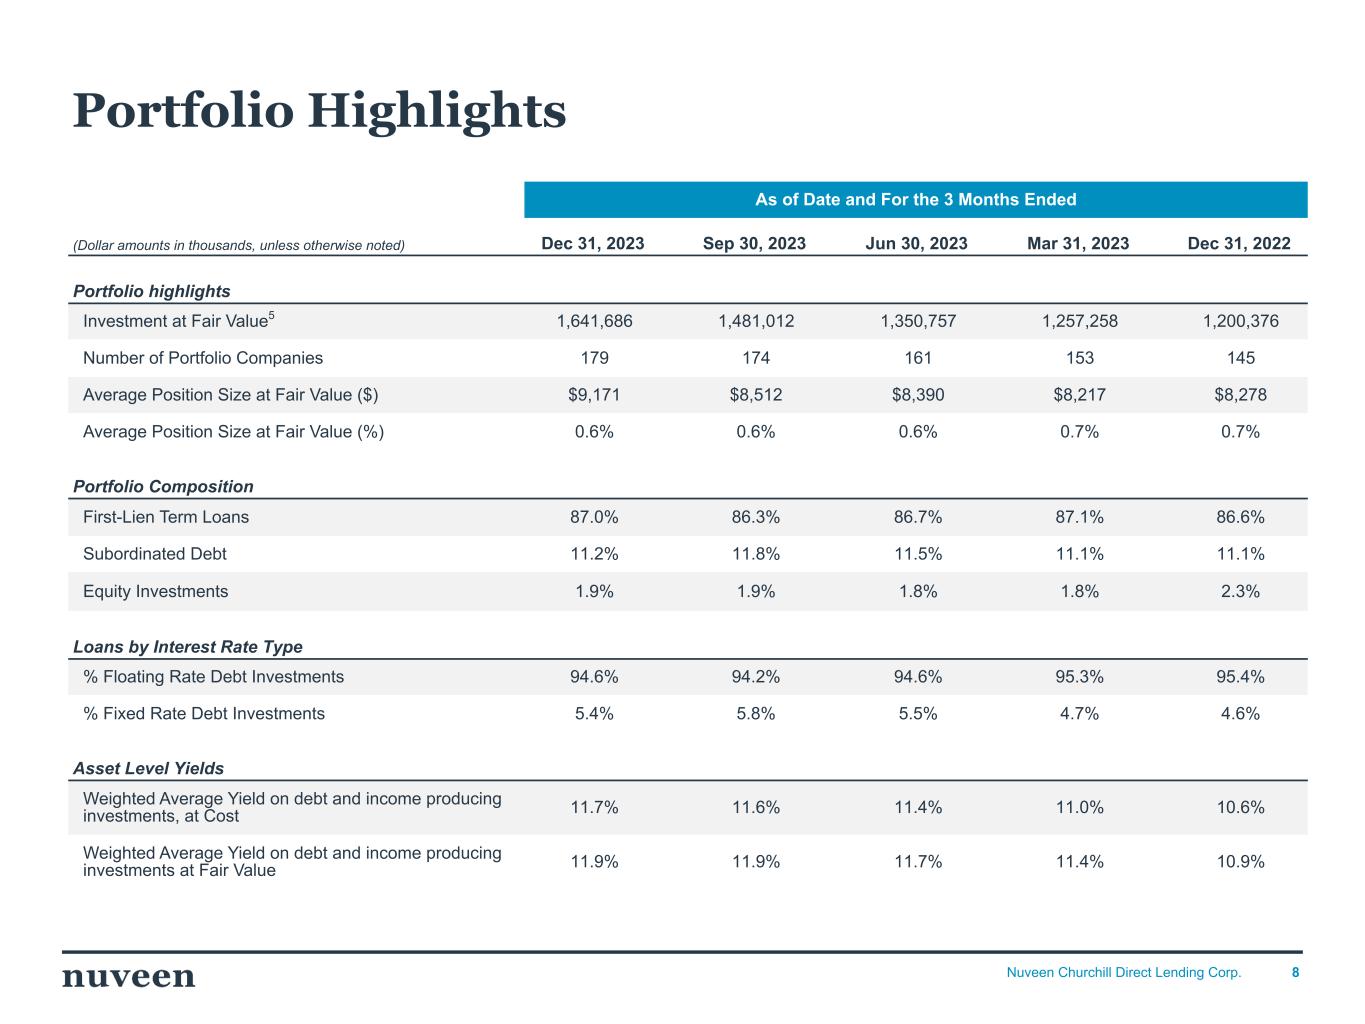
8Nuveen Churchill Direct Lending Corp. As of Date and For the 3 Months Ended (Dollar amounts in thousands, unless otherwise noted) Dec 31, 2023 Sep 30, 2023 Jun 30, 2023 Mar 31, 2023 Dec 31, 2022 Portfolio highlights Investment at Fair Value5 1,641,686 1,481,012 1,350,757 1,257,258 1,200,376 Number of Portfolio Companies 179 174 161 153 145 Average Position Size at Fair Value ($) $9,171 $8,512 $8,390 $8,217 $8,278 Average Position Size at Fair Value (%) 0.6% 0.6% 0.6% 0.7% 0.7% Portfolio Composition First-Lien Term Loans 87.0% 86.3% 86.7% 87.1% 86.6% Subordinated Debt 11.2% 11.8% 11.5% 11.1% 11.1% Equity Investments 1.9% 1.9% 1.8% 1.8% 2.3% Loans by Interest Rate Type % Floating Rate Debt Investments 94.6% 94.2% 94.6% 95.3% 95.4% % Fixed Rate Debt Investments 5.4% 5.8% 5.5% 4.7% 4.6% Asset Level Yields Weighted Average Yield on debt and income producing investments, at Cost 11.7% 11.6% 11.4% 11.0% 10.6% Weighted Average Yield on debt and income producing investments at Fair Value 11.9% 11.9% 11.7% 11.4% 10.9% Portfolio Highlights
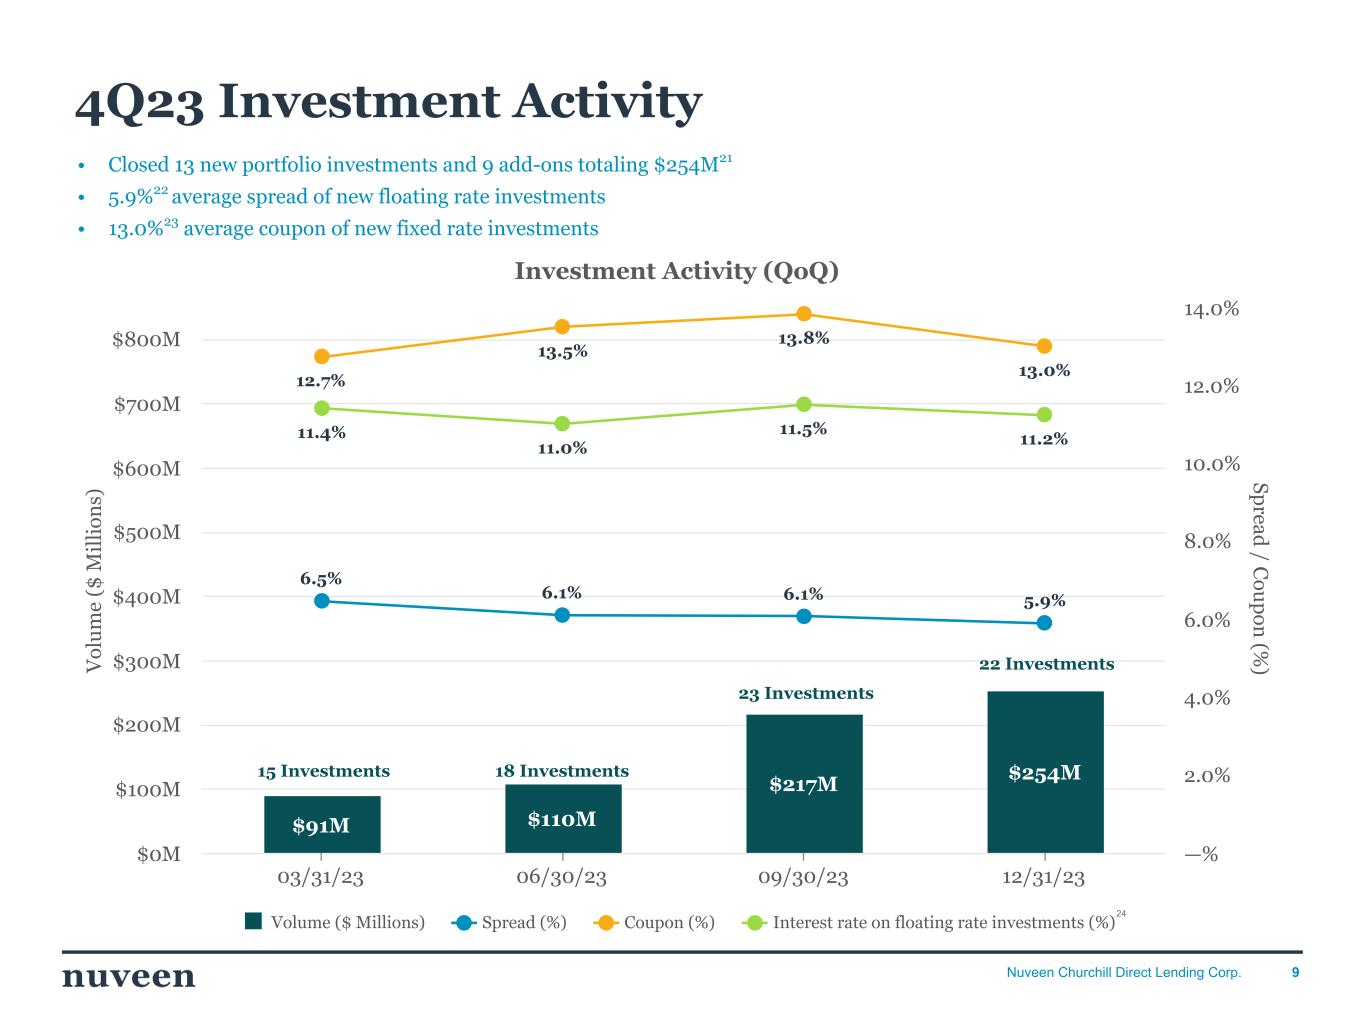
9Nuveen Churchill Direct Lending Corp. V ol u m e ($ M il li on s) Sp read / C ou p on (% ) Investment Activity (QoQ) $91M $110M $217M $254M 6.5% 6.1% 6.1% 5.9% 12.7% 13.5% 13.8% 13.0% 11.4% 11.0% 11.5% 11.2% Volume ($ Millions) Spread (%) Coupon (%) Interest rate on floating rate investments (%) 03/31/23 06/30/23 09/30/23 12/31/23 $0M $100M $200M $300M $400M $500M $600M $700M $800M —% 2.0% 4.0% 6.0% 8.0% 10.0% 12.0% 14.0% • Closed 13 new portfolio investments and 9 add-ons totaling $254M21 • 5.9%22 average spread of new floating rate investments • 13.0%23 average coupon of new fixed rate investments 4Q23 Investment Activity 15 Investments 18 Investments 24 PLEASE DO NOT TOUCH THE FORMATTING (MOVE AROUND BOXES, CHANGE CHARTS ETC.) THANK YOU!!! 22 Investments 23 Investments

10Nuveen Churchill Direct Lending Corp. Services: Business Healthcare & Pharmaceuticals High Tech Industries Beverage, Food & Tobacco Automotive Services: Consumer Capital Equipment Containers, Packaging & Glass Banking, Finance, Insurance, Real Estate Construction & Building Other (15) First Lien Term Loan (including DDTLs) Subordinated Debt Equity Portfolio Overview Average Asset Yield6 11.9% Average Position Size25 Key Portfolio Statistics 18.6 % 12.4 % 9.0 % 7.8 % 5.2 % 4.9 % 4.0 % 4.0 % 4.0 % 3.9 % 26.3 % 87.0 % 11.2 % 1.9 % 2687% First Lien Portfolio composition by investment type7 Portfolio diversification by Moody’s Industry Investment Portfolio at Fair Value5 $1.6B Portfolio Companies 179 PLEASE DO NOT TOUCH THE FORMATTING (MOVE AROUND BOXES, CHANGE CHARTS ETC.) THANK YOU!!! <1%
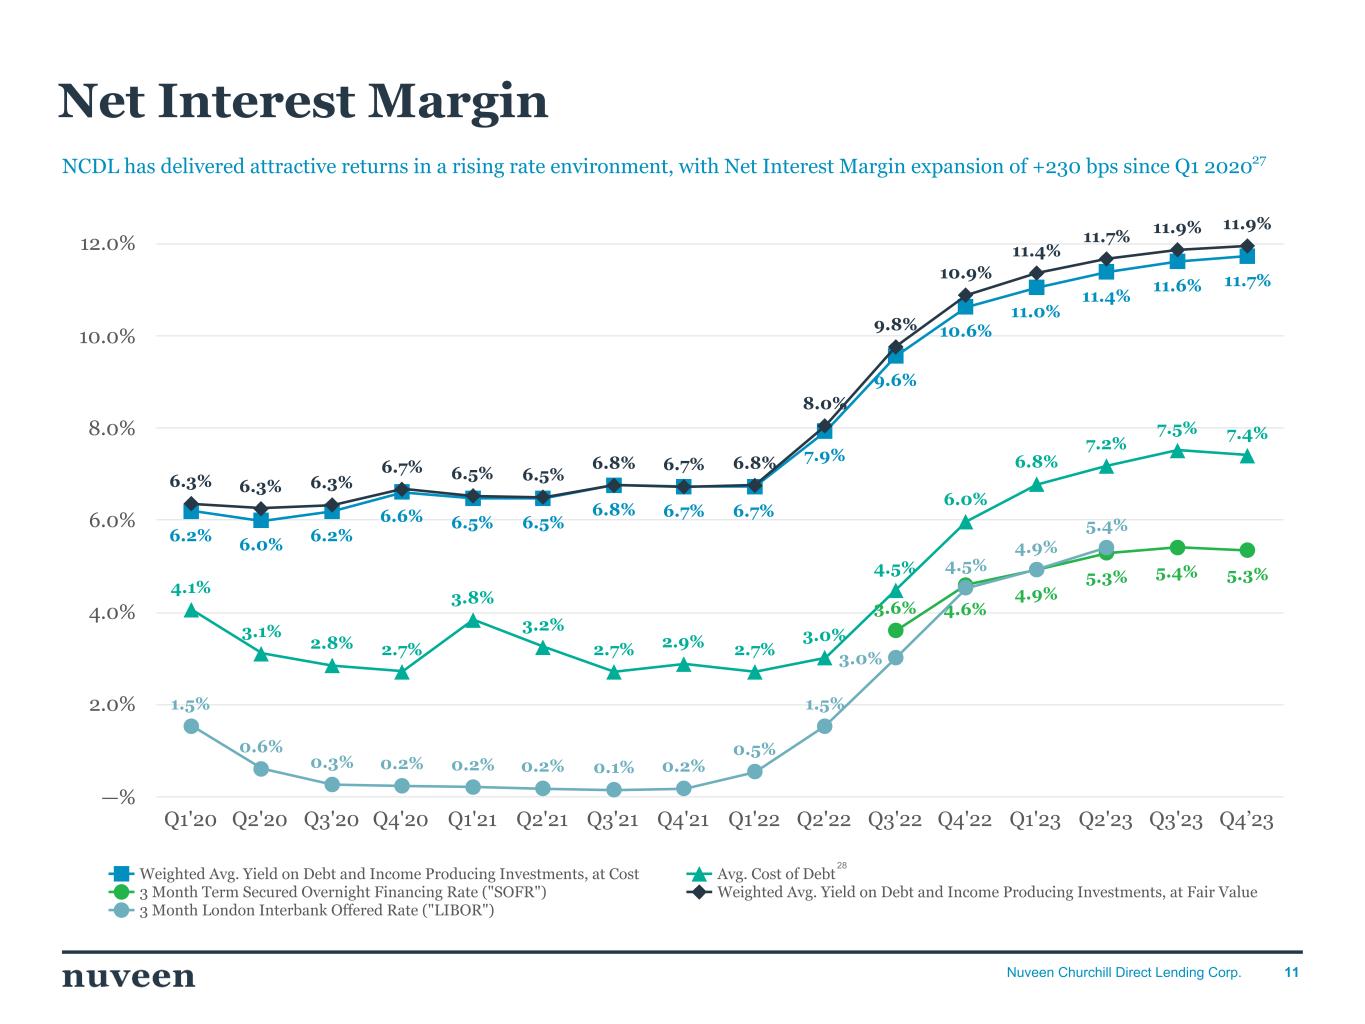
11Nuveen Churchill Direct Lending Corp. NCDL has delivered attractive returns in a rising rate environment, with Net Interest Margin expansion of +230 bps since Q1 202027 Net Interest Margin 6.2% 6.0% 6.2% 6.6% 6.5% 6.5% 6.8% 6.7% 6.7% 7.9% 9.6% 10.6% 11.0% 11.4% 11.6% 11.7% 4.1% 3.1% 2.8% 2.7% 3.8% 3.2% 2.7% 2.9% 2.7% 3.0% 4.5% 6.0% 6.8% 7.2% 7.5% 7.4% 3.6% 4.6% 4.9% 5.3% 5.4% 5.3% 6.3% 6.3% 6.3% 6.7% 6.5% 6.5% 6.8% 6.7% 6.8% 8.0% 9.8% 10.9% 11.4% 11.7% 11.9% 11.9% 1.5% 0.6% 0.3% 0.2% 0.2% 0.2% 0.1% 0.2% 0.5% 1.5% 3.0% 4.5% 4.9% 5.4% Weighted Avg. Yield on Debt and Income Producing Investments, at Cost Avg. Cost of Debt 3 Month Term Secured Overnight Financing Rate ("SOFR") Weighted Avg. Yield on Debt and Income Producing Investments, at Fair Value 3 Month London Interbank Offered Rate ("LIBOR") Q1'20 Q2'20 Q3'20 Q4'20 Q1'21 Q2'21 Q3'21 Q4'21 Q1'22 Q2'22 Q3'22 Q4'22 Q1'23 Q2'23 Q3'23 Q4’23 —% 2.0% 4.0% 6.0% 8.0% 10.0% 12.0% 28
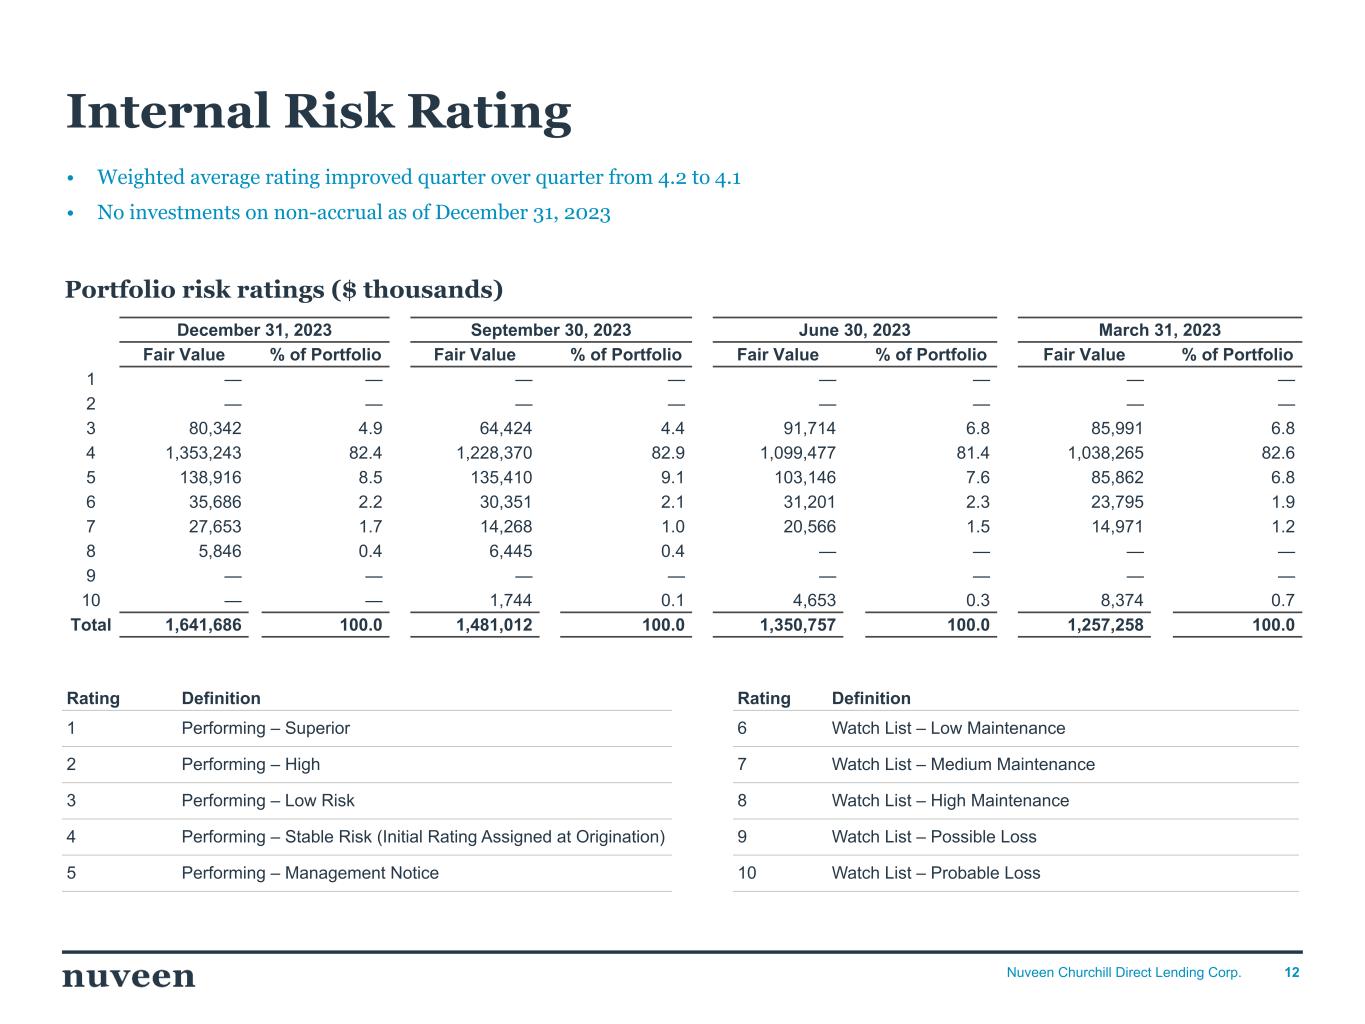
12Nuveen Churchill Direct Lending Corp. Internal Risk Rating Portfolio risk ratings ($ thousands) December 31, 2023 September 30, 2023 June 30, 2023 March 31, 2023 Fair Value % of Portfolio Fair Value % of Portfolio Fair Value % of Portfolio Fair Value % of Portfolio 1 — — — — — — — — 2 — — — — — — — — 3 80,342 4.9 64,424 4.4 91,714 6.8 85,991 6.8 4 1,353,243 82.4 1,228,370 82.9 1,099,477 81.4 1,038,265 82.6 5 138,916 8.5 135,410 9.1 103,146 7.6 85,862 6.8 6 35,686 2.2 30,351 2.1 31,201 2.3 23,795 1.9 7 27,653 1.7 14,268 1.0 20,566 1.5 14,971 1.2 8 5,846 0.4 6,445 0.4 — — — — 9 — — — — — — — — 10 — — 1,744 0.1 4,653 0.3 8,374 0.7 Total 1,641,686 100.0 1,481,012 100.0 1,350,757 100.0 1,257,258 100.0 Rating Definition Rating Definition 1 Performing – Superior 6 Watch List – Low Maintenance 2 Performing – High 7 Watch List – Medium Maintenance 3 Performing – Low Risk 8 Watch List – High Maintenance 4 Performing – Stable Risk (Initial Rating Assigned at Origination) 9 Watch List – Possible Loss 5 Performing – Management Notice 10 Watch List – Probable Loss • Weighted average rating improved quarter over quarter from 4.2 to 4.1 • No investments on non-accrual as of December 31, 2023
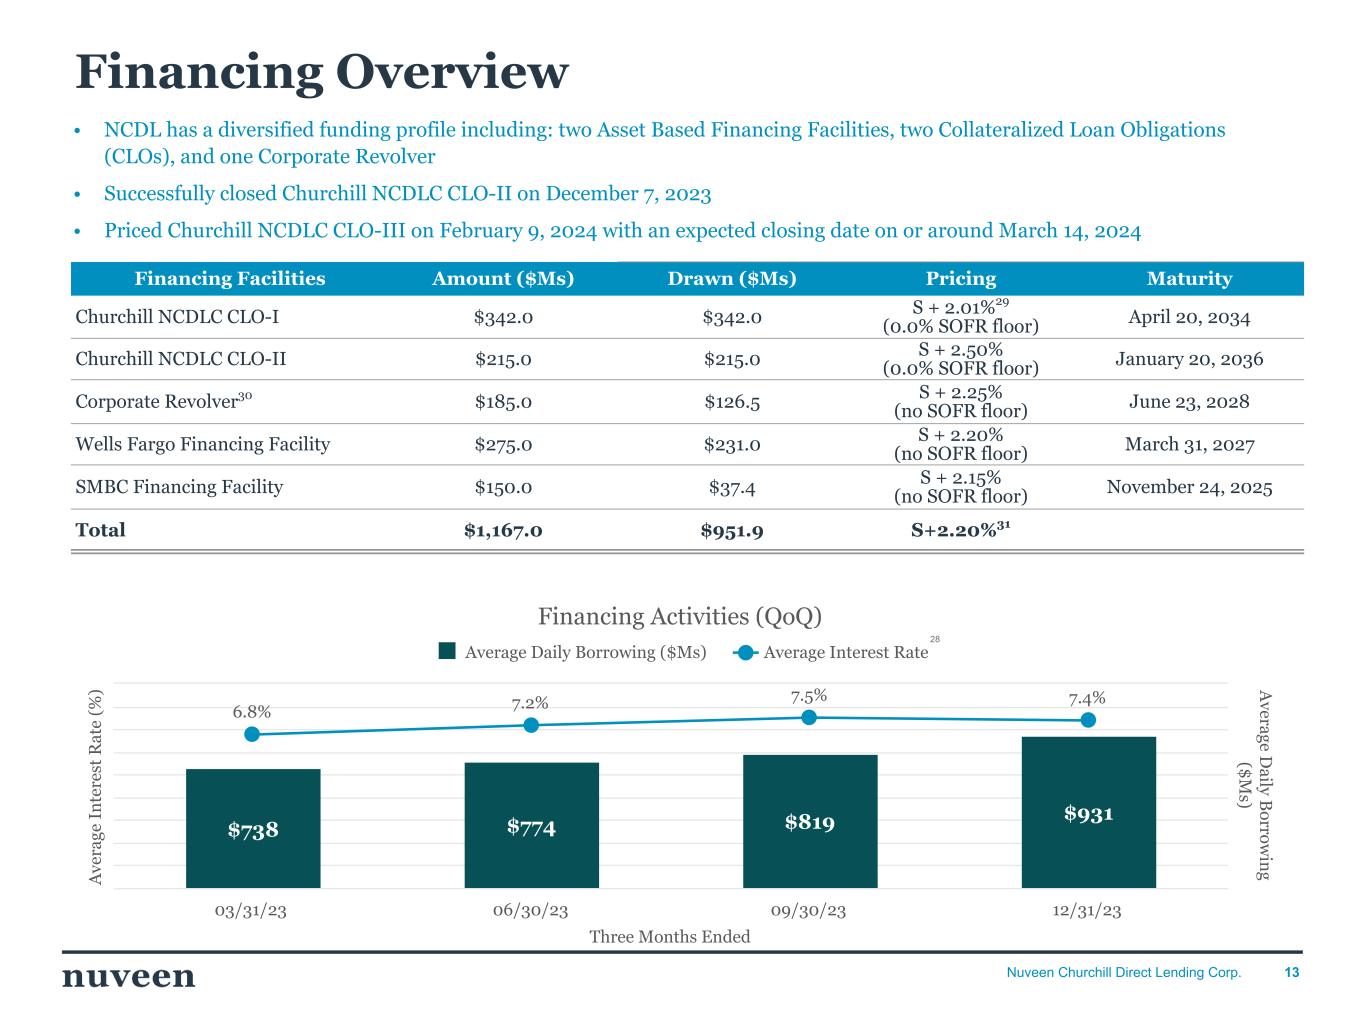
13Nuveen Churchill Direct Lending Corp. Financing Overview Three Months Ended A ve ra ge I n te re st R at e (% ) A verage D aily B orrow in g ($ M s) Financing Activities (QoQ) $738 $774 $819 $931 6.8% 7.2% 7.5% 7.4% Average Daily Borrowing ($Ms) Average Interest Rate 03/31/23 06/30/23 09/30/23 12/31/23 28 Financing Facilities Amount ($Ms) Drawn ($Ms) Pricing Maturity Churchill NCDLC CLO-I $342.0 $342.0 S + 2.01%29 (0.0% SOFR floor) April 20, 2034 Churchill NCDLC CLO-II $215.0 $215.0 S + 2.50% (0.0% SOFR floor) January 20, 2036 Corporate Revolver30 $185.0 $126.5 S + 2.25% (no SOFR floor) June 23, 2028 Wells Fargo Financing Facility $275.0 $231.0 S + 2.20% (no SOFR floor) March 31, 2027 SMBC Financing Facility $150.0 $37.4 S + 2.15% (no SOFR floor) November 24, 2025 Total $1,167.0 $951.9 S+2.20%31 • NCDL has a diversified funding profile including: two Asset Based Financing Facilities, two Collateralized Loan Obligations (CLOs), and one Corporate Revolver • Successfully closed Churchill NCDLC CLO-II on December 7, 2023 • Priced Churchill NCDLC CLO-III on February 9, 2024 with an expected closing date on or around March 14, 2024
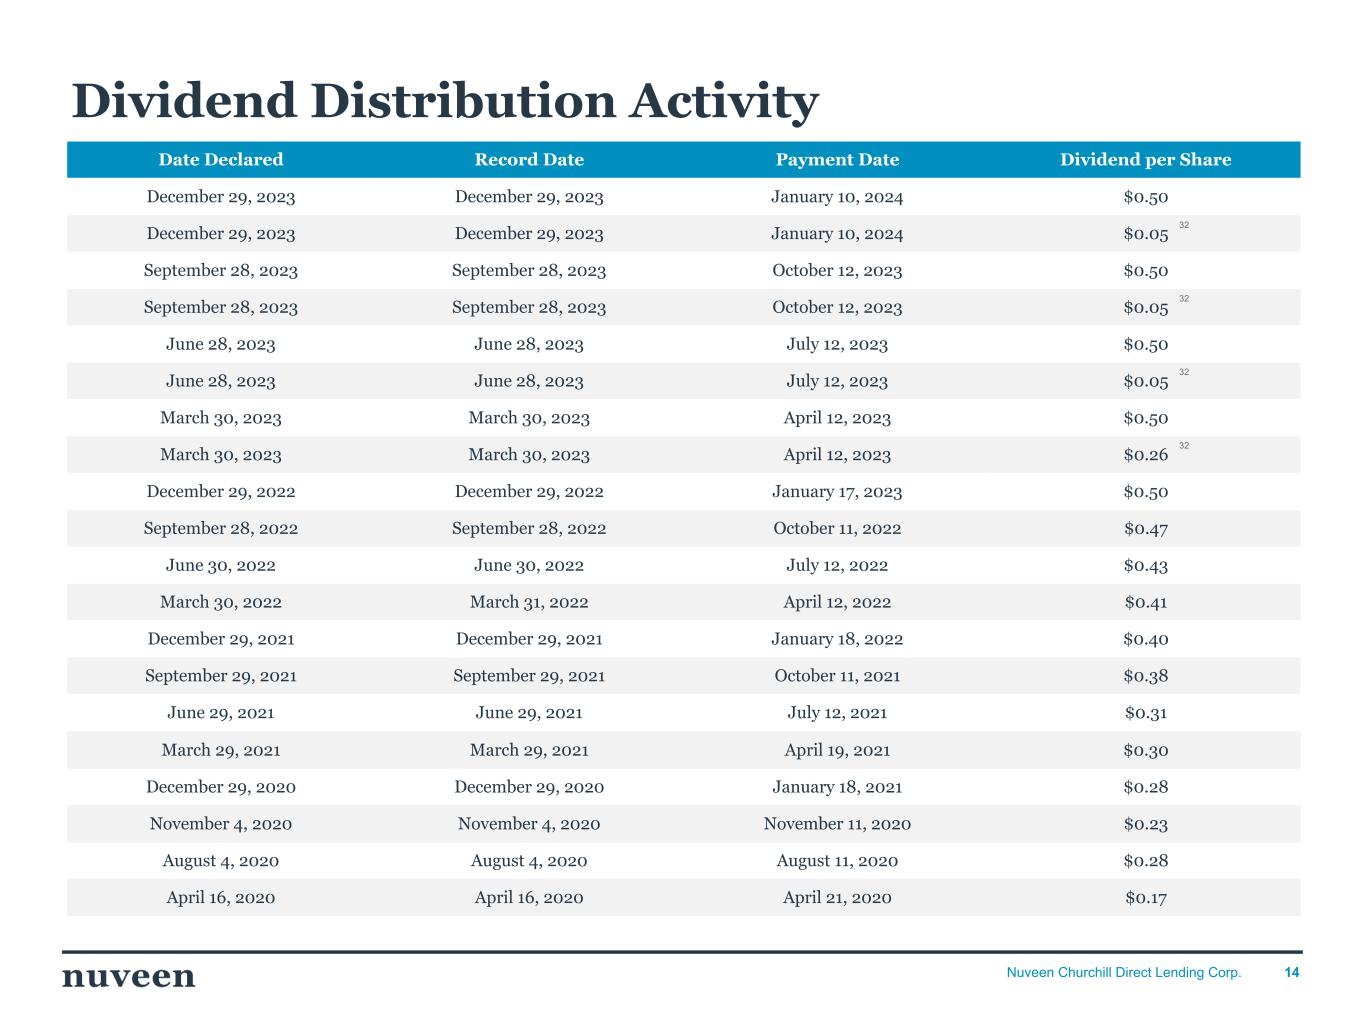
14Nuveen Churchill Direct Lending Corp. Dividend Distribution Activity Date Declared Record Date Payment Date Dividend per Share December 29, 2023 December 29, 2023 January 10, 2024 $0.50 December 29, 2023 December 29, 2023 January 10, 2024 $0.05 September 28, 2023 September 28, 2023 October 12, 2023 $0.50 September 28, 2023 September 28, 2023 October 12, 2023 $0.05 June 28, 2023 June 28, 2023 July 12, 2023 $0.50 June 28, 2023 June 28, 2023 July 12, 2023 $0.05 March 30, 2023 March 30, 2023 April 12, 2023 $0.50 March 30, 2023 March 30, 2023 April 12, 2023 $0.26 December 29, 2022 December 29, 2022 January 17, 2023 $0.50 September 28, 2022 September 28, 2022 October 11, 2022 $0.47 June 30, 2022 June 30, 2022 July 12, 2022 $0.43 March 30, 2022 March 31, 2022 April 12, 2022 $0.41 December 29, 2021 December 29, 2021 January 18, 2022 $0.40 September 29, 2021 September 29, 2021 October 11, 2021 $0.38 June 29, 2021 June 29, 2021 July 12, 2021 $0.31 March 29, 2021 March 29, 2021 April 19, 2021 $0.30 December 29, 2020 December 29, 2020 January 18, 2021 $0.28 November 4, 2020 November 4, 2020 November 11, 2020 $0.23 August 4, 2020 August 4, 2020 August 11, 2020 $0.28 April 16, 2020 April 16, 2020 April 21, 2020 $0.17 32 32 32 32
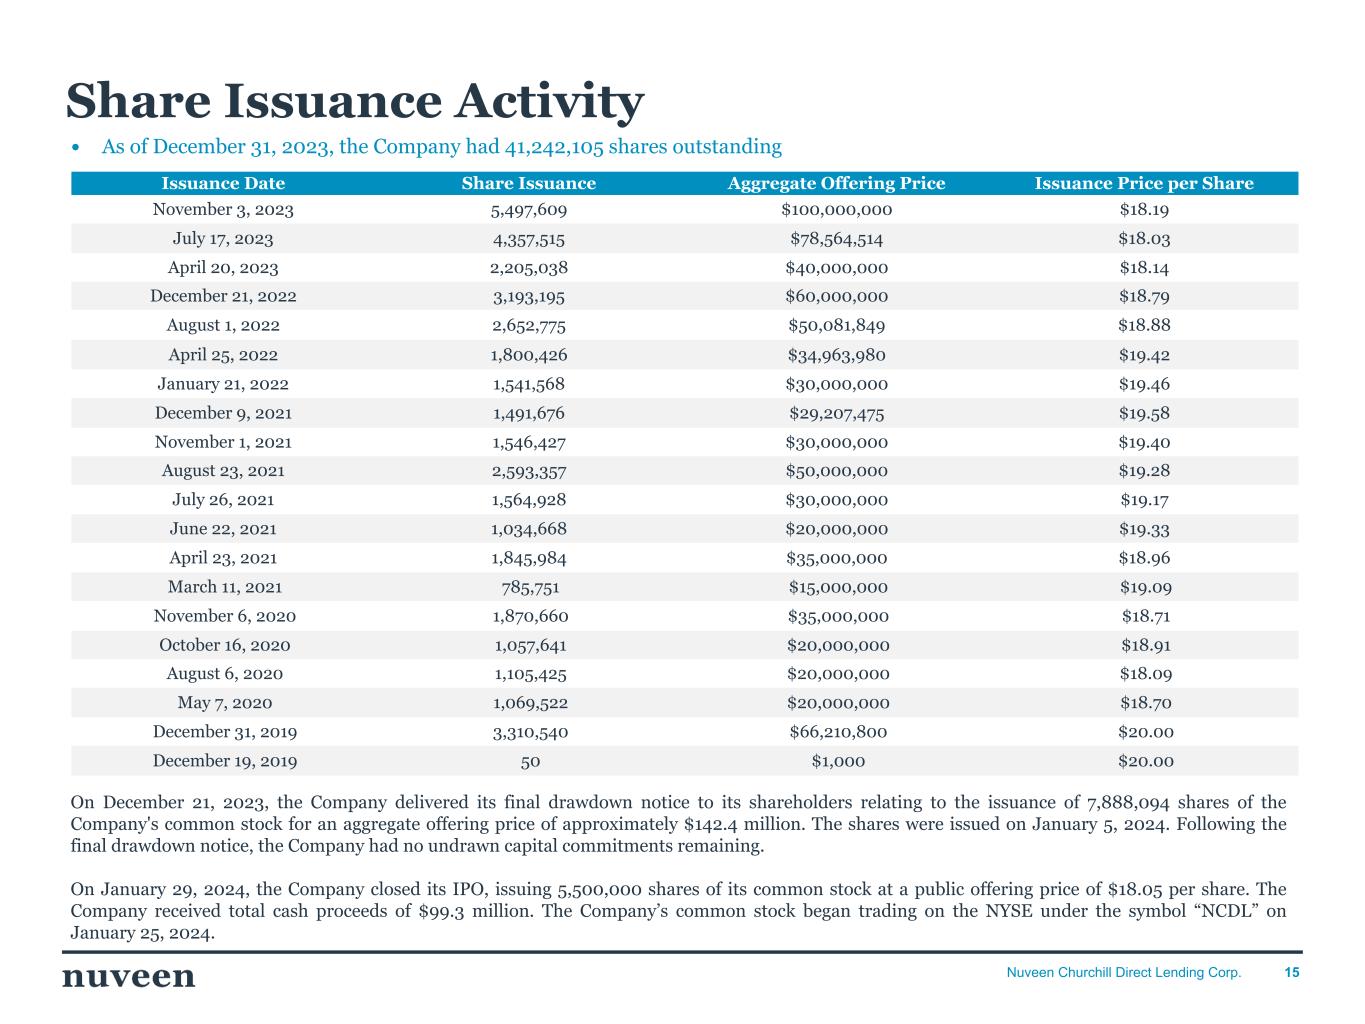
15Nuveen Churchill Direct Lending Corp. Share Issuance Activity Issuance Date Share Issuance Aggregate Offering Price Issuance Price per Share November 3, 2023 5,497,609 $100,000,000 $18.19 July 17, 2023 4,357,515 $78,564,514 $18.03 April 20, 2023 2,205,038 $40,000,000 $18.14 December 21, 2022 3,193,195 $60,000,000 $18.79 August 1, 2022 2,652,775 $50,081,849 $18.88 April 25, 2022 1,800,426 $34,963,980 $19.42 January 21, 2022 1,541,568 $30,000,000 $19.46 December 9, 2021 1,491,676 $29,207,475 $19.58 November 1, 2021 1,546,427 $30,000,000 $19.40 August 23, 2021 2,593,357 $50,000,000 $19.28 July 26, 2021 1,564,928 $30,000,000 $19.17 June 22, 2021 1,034,668 $20,000,000 $19.33 April 23, 2021 1,845,984 $35,000,000 $18.96 March 11, 2021 785,751 $15,000,000 $19.09 November 6, 2020 1,870,660 $35,000,000 $18.71 October 16, 2020 1,057,641 $20,000,000 $18.91 August 6, 2020 1,105,425 $20,000,000 $18.09 May 7, 2020 1,069,522 $20,000,000 $18.70 December 31, 2019 3,310,540 $66,210,800 $20.00 December 19, 2019 50 $1,000 $20.00 • As of December 31, 2023, the Company had 41,242,105 shares outstanding On December 21, 2023, the Company delivered its final drawdown notice to its shareholders relating to the issuance of 7,888,094 shares of the Company's common stock for an aggregate offering price of approximately $142.4 million. The shares were issued on January 5, 2024. Following the final drawdown notice, the Company had no undrawn capital commitments remaining. On January 29, 2024, the Company closed its IPO, issuing 5,500,000 shares of its common stock at a public offering price of $18.05 per share. The Company received total cash proceeds of $99.3 million. The Company’s common stock began trading on the NYSE under the symbol “NCDL” on January 25, 2024.
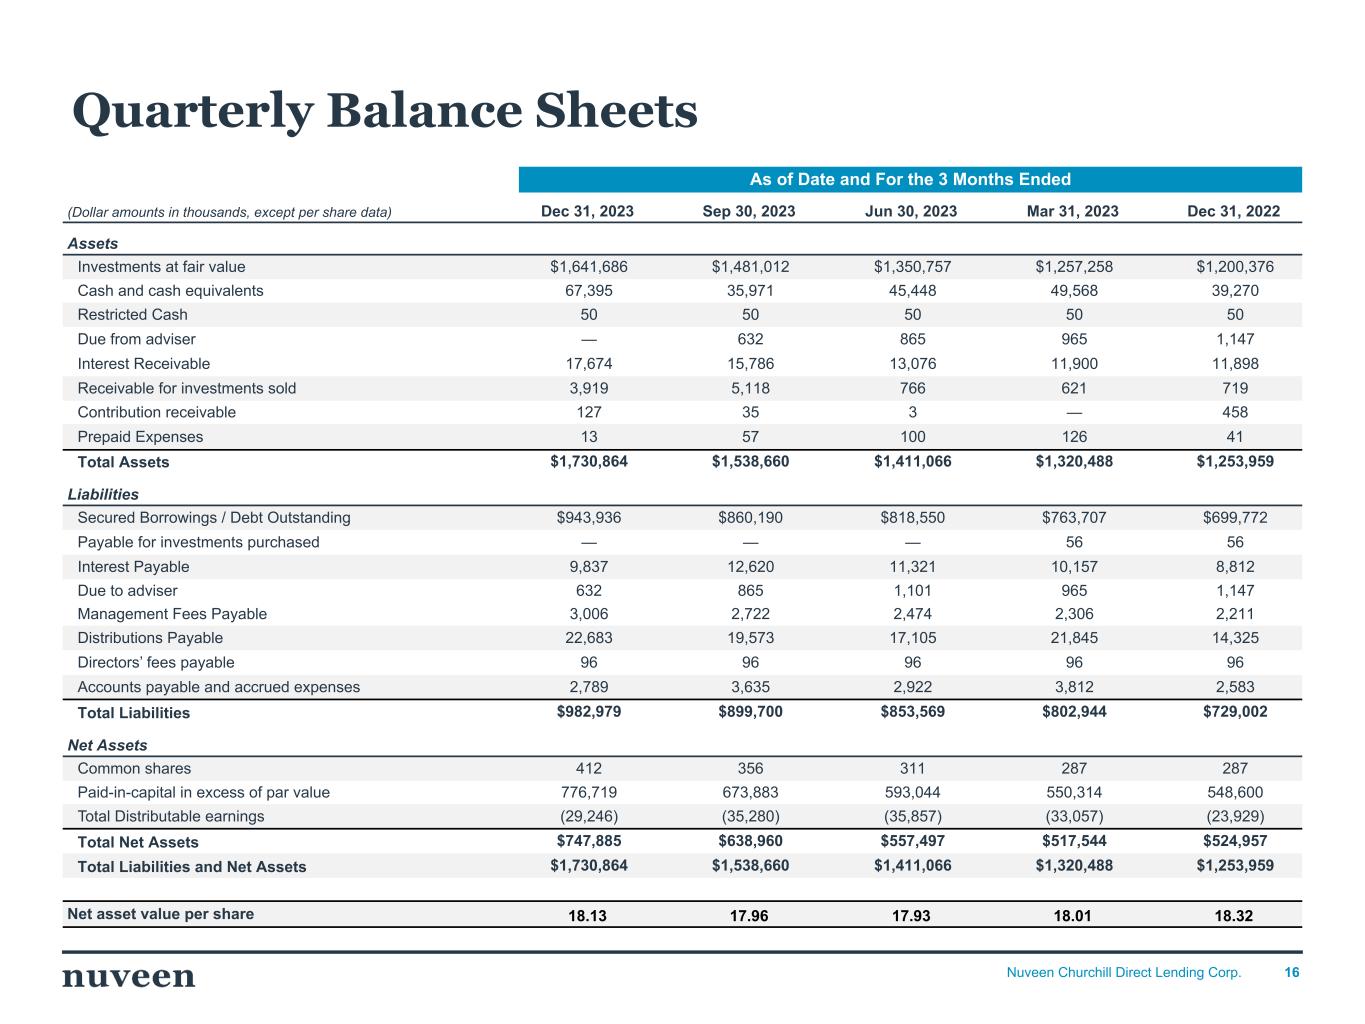
16Nuveen Churchill Direct Lending Corp. As of Date and For the 3 Months Ended (Dollar amounts in thousands, except per share data) Dec 31, 2023 Sep 30, 2023 Jun 30, 2023 Mar 31, 2023 Dec 31, 2022 Assets Investments at fair value $1,641,686 $1,481,012 $1,350,757 $1,257,258 $1,200,376 Cash and cash equivalents 67,395 35,971 45,448 49,568 39,270 Restricted Cash 50 50 50 50 50 Due from adviser — 632 865 965 1,147 Interest Receivable 17,674 15,786 13,076 11,900 11,898 Receivable for investments sold 3,919 5,118 766 621 719 Contribution receivable 127 35 3 — 458 Prepaid Expenses 13 57 100 126 41 Total Assets $1,730,864 $1,538,660 $1,411,066 $1,320,488 $1,253,959 Liabilities Secured Borrowings / Debt Outstanding $943,936 $860,190 $818,550 $763,707 $699,772 Payable for investments purchased — — — 56 56 Interest Payable 9,837 12,620 11,321 10,157 8,812 Due to adviser 632 865 1,101 965 1,147 Management Fees Payable 3,006 2,722 2,474 2,306 2,211 Distributions Payable 22,683 19,573 17,105 21,845 14,325 Directors’ fees payable 96 96 96 96 96 Accounts payable and accrued expenses 2,789 3,635 2,922 3,812 2,583 Total Liabilities $982,979 $899,700 $853,569 $802,944 $729,002 Net Assets Common shares 412 356 311 287 287 Paid-in-capital in excess of par value 776,719 673,883 593,044 550,314 548,600 Total Distributable earnings (29,246) (35,280) (35,857) (33,057) (23,929) Total Net Assets $747,885 $638,960 $557,497 $517,544 $524,957 Total Liabilities and Net Assets $1,730,864 $1,538,660 $1,411,066 $1,320,488 $1,253,959 Net asset value per share 18.13 17.96 17.93 18.01 18.32 Quarterly Balance Sheets
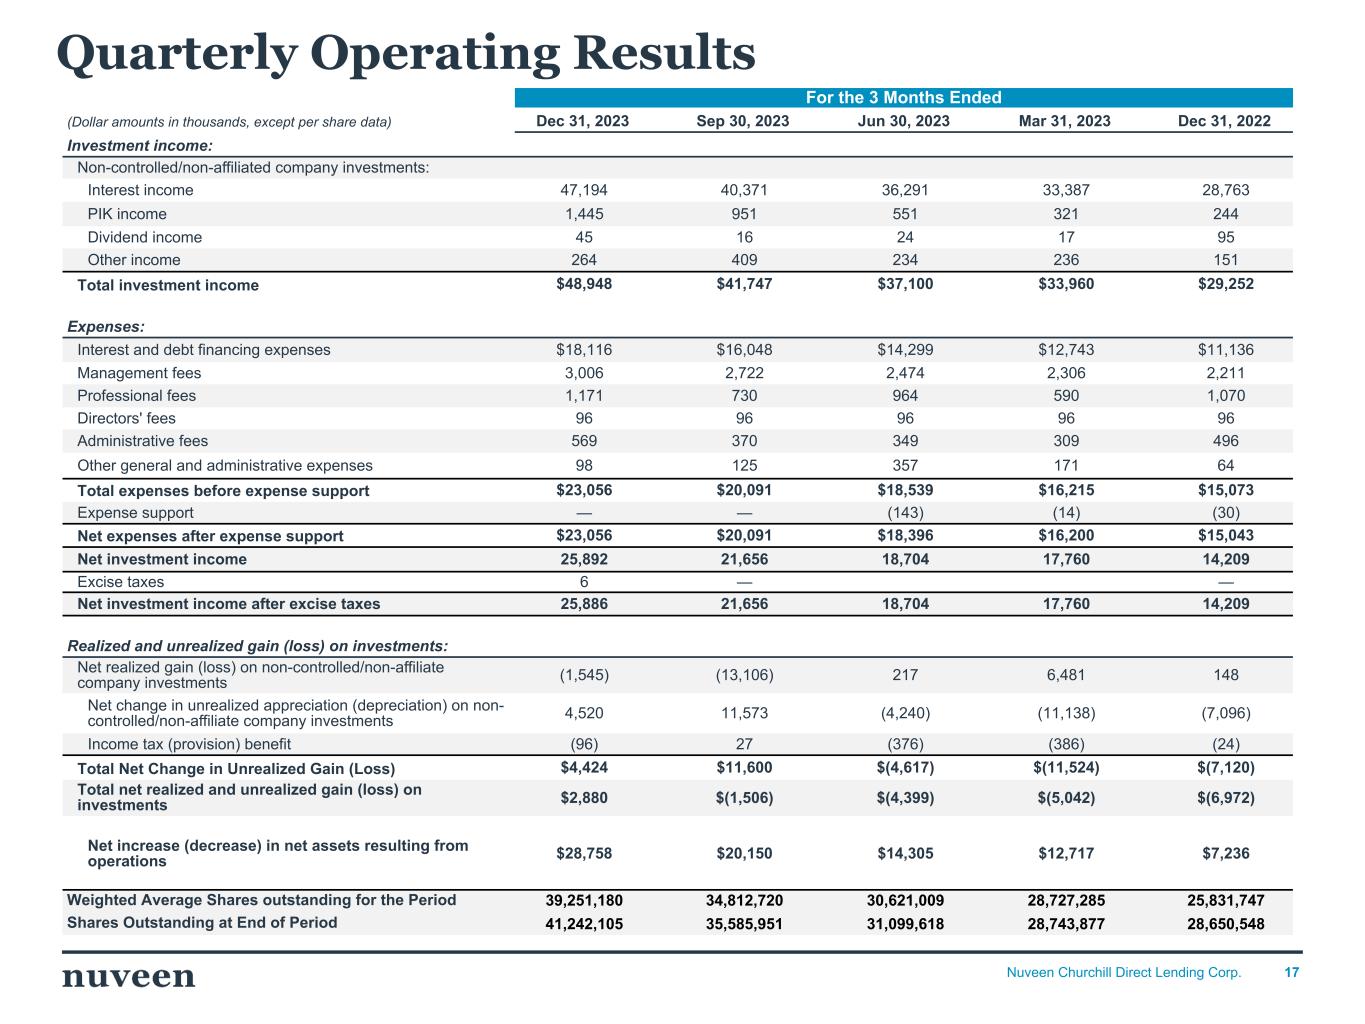
17Nuveen Churchill Direct Lending Corp. For the 3 Months Ended (Dollar amounts in thousands, except per share data) Dec 31, 2023 Sep 30, 2023 Jun 30, 2023 Mar 31, 2023 Dec 31, 2022 Investment income: Non-controlled/non-affiliated company investments: Interest income 47,194 40,371 36,291 33,387 28,763 PIK income 1,445 951 551 321 244 Dividend income 45 16 24 17 95 Other income 264 409 234 236 151 Total investment income $48,948 $41,747 $37,100 $33,960 $29,252 Expenses: Interest and debt financing expenses $18,116 $16,048 $14,299 $12,743 $11,136 Management fees 3,006 2,722 2,474 2,306 2,211 Professional fees 1,171 730 964 590 1,070 Directors' fees 96 96 96 96 96 Administrative fees 569 370 349 309 496 Other general and administrative expenses 98 125 357 171 64 Total expenses before expense support $23,056 $20,091 $18,539 $16,215 $15,073 Expense support — — (143) (14) (30) Net expenses after expense support $23,056 $20,091 $18,396 $16,200 $15,043 Net investment income 25,892 21,656 18,704 17,760 14,209 Excise taxes 6 — — Net investment income after excise taxes 25,886 21,656 18,704 17,760 14,209 Realized and unrealized gain (loss) on investments: Net realized gain (loss) on non-controlled/non-affiliate company investments (1,545) (13,106) 217 6,481 148 Net change in unrealized appreciation (depreciation) on non- controlled/non-affiliate company investments 4,520 11,573 (4,240) (11,138) (7,096) Income tax (provision) benefit (96) 27 (376) (386) (24) Total Net Change in Unrealized Gain (Loss) $4,424 $11,600 $(4,617) $(11,524) $(7,120) Total net realized and unrealized gain (loss) on investments $2,880 $(1,506) $(4,399) $(5,042) $(6,972) Net increase (decrease) in net assets resulting from operations $28,758 $20,150 $14,305 $12,717 $7,236 Weighted Average Shares outstanding for the Period 39,251,180 34,812,720 30,621,009 28,727,285 25,831,747 Shares Outstanding at End of Period 41,242,105 35,585,951 31,099,618 28,743,877 28,650,548 Quarterly Operating Results

18Nuveen Churchill Direct Lending Corp. Our website www.NCDL.com Investor Relations NCDL-IR@churchillam.com Contact Us
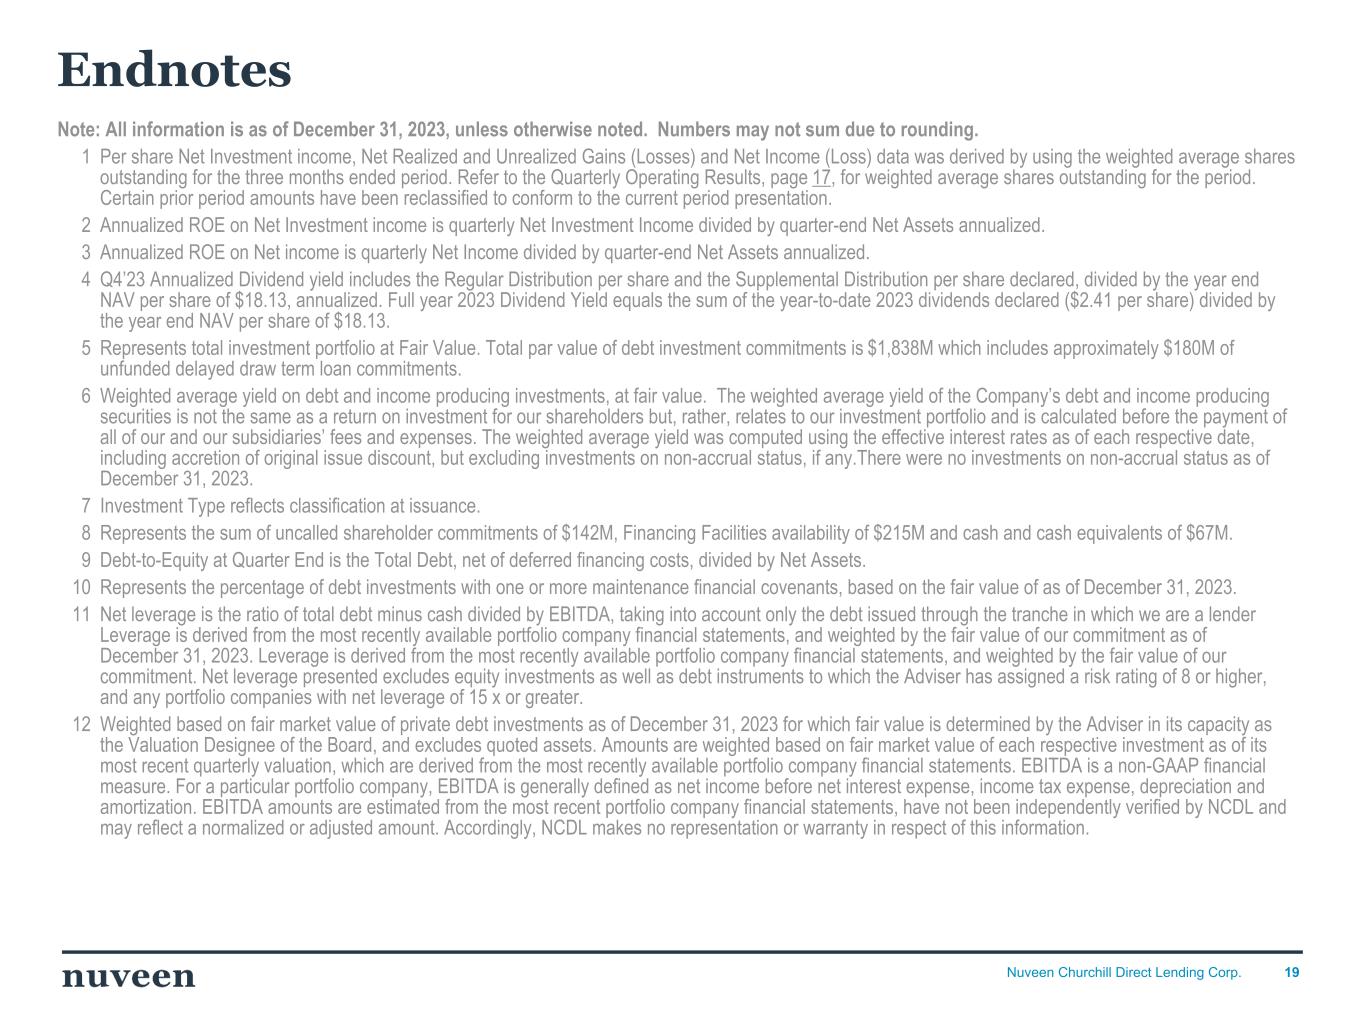
19Nuveen Churchill Direct Lending Corp. Note: All information is as of December 31, 2023, unless otherwise noted. Numbers may not sum due to rounding. 1 Per share Net Investment income, Net Realized and Unrealized Gains (Losses) and Net Income (Loss) data was derived by using the weighted average shares outstanding for the three months ended period. Refer to the Quarterly Operating Results, page 17, for weighted average shares outstanding for the period. Certain prior period amounts have been reclassified to conform to the current period presentation. 2 Annualized ROE on Net Investment income is quarterly Net Investment Income divided by quarter-end Net Assets annualized. 3 Annualized ROE on Net income is quarterly Net Income divided by quarter-end Net Assets annualized. 4 Q4’23 Annualized Dividend yield includes the Regular Distribution per share and the Supplemental Distribution per share declared, divided by the year end NAV per share of $18.13, annualized. Full year 2023 Dividend Yield equals the sum of the year-to-date 2023 dividends declared ($2.41 per share) divided by the year end NAV per share of $18.13. 5 Represents total investment portfolio at Fair Value. Total par value of debt investment commitments is $1,838M which includes approximately $180M of unfunded delayed draw term loan commitments. 6 Weighted average yield on debt and income producing investments, at fair value. The weighted average yield of the Company’s debt and income producing securities is not the same as a return on investment for our shareholders but, rather, relates to our investment portfolio and is calculated before the payment of all of our and our subsidiaries’ fees and expenses. The weighted average yield was computed using the effective interest rates as of each respective date, including accretion of original issue discount, but excluding investments on non-accrual status, if any.There were no investments on non-accrual status as of December 31, 2023. 7 Investment Type reflects classification at issuance. 8 Represents the sum of uncalled shareholder commitments of $142M, Financing Facilities availability of $215M and cash and cash equivalents of $67M. 9 Debt-to-Equity at Quarter End is the Total Debt, net of deferred financing costs, divided by Net Assets. 10 Represents the percentage of debt investments with one or more maintenance financial covenants, based on the fair value of as of December 31, 2023. 11 Net leverage is the ratio of total debt minus cash divided by EBITDA, taking into account only the debt issued through the tranche in which we are a lender Leverage is derived from the most recently available portfolio company financial statements, and weighted by the fair value of our commitment as of December 31, 2023. Leverage is derived from the most recently available portfolio company financial statements, and weighted by the fair value of our commitment. Net leverage presented excludes equity investments as well as debt instruments to which the Adviser has assigned a risk rating of 8 or higher, and any portfolio companies with net leverage of 15 x or greater. 12 Weighted based on fair market value of private debt investments as of December 31, 2023 for which fair value is determined by the Adviser in its capacity as the Valuation Designee of the Board, and excludes quoted assets. Amounts are weighted based on fair market value of each respective investment as of its most recent quarterly valuation, which are derived from the most recently available portfolio company financial statements. EBITDA is a non-GAAP financial measure. For a particular portfolio company, EBITDA is generally defined as net income before net interest expense, income tax expense, depreciation and amortization. EBITDA amounts are estimated from the most recent portfolio company financial statements, have not been independently verified by NCDL and may reflect a normalized or adjusted amount. Accordingly, NCDL makes no representation or warranty in respect of this information. Endnotes
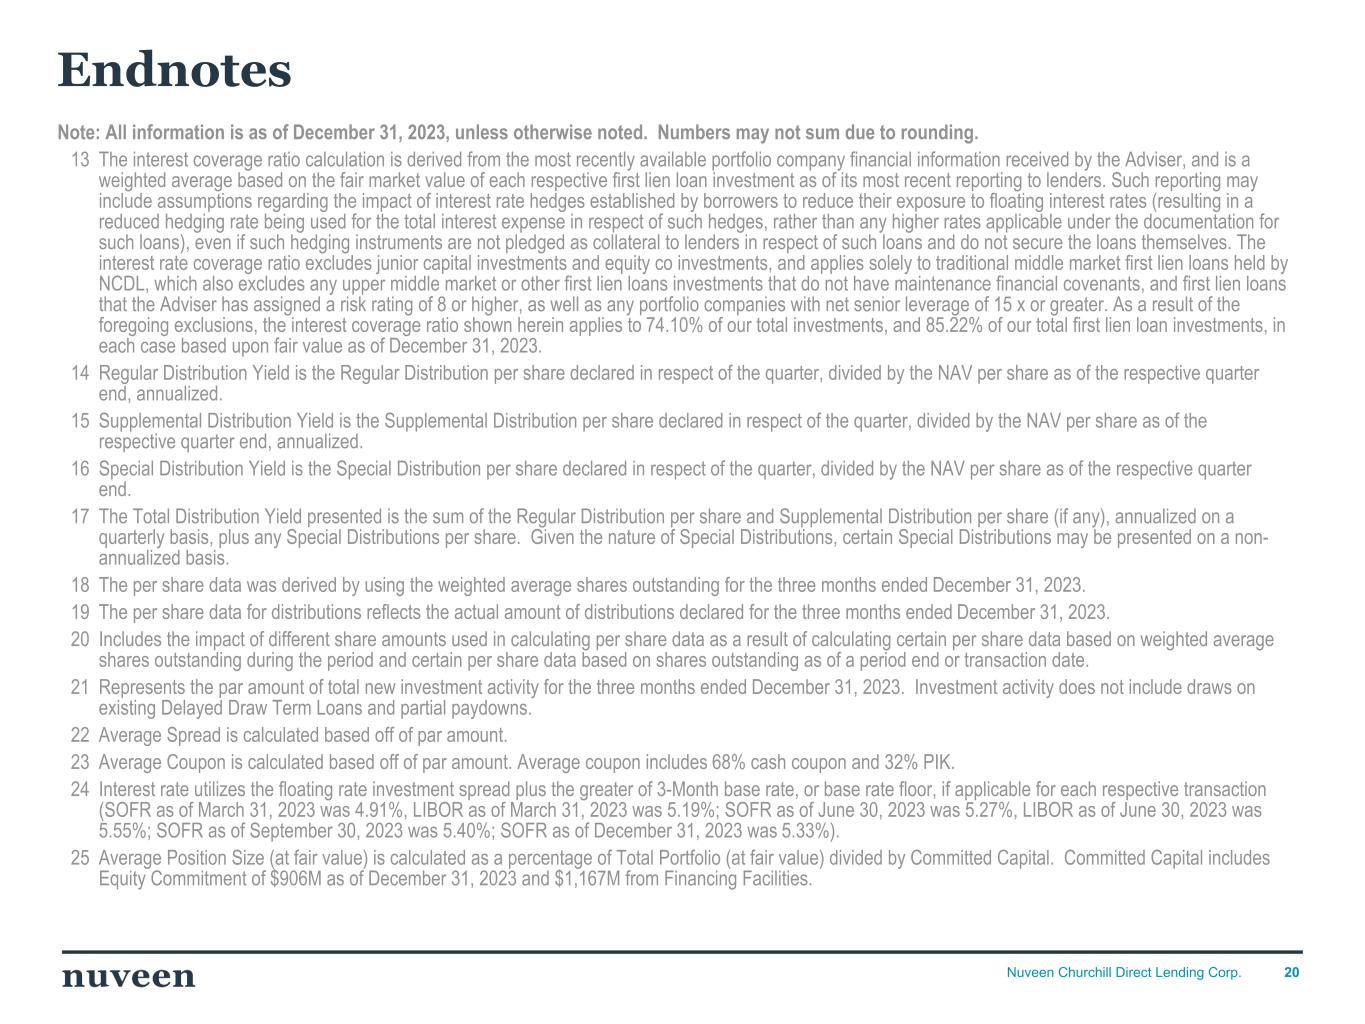
20Nuveen Churchill Direct Lending Corp. Note: All information is as of December 31, 2023, unless otherwise noted. Numbers may not sum due to rounding. 13 The interest coverage ratio calculation is derived from the most recently available portfolio company financial information received by the Adviser, and is a weighted average based on the fair market value of each respective first lien loan investment as of its most recent reporting to lenders. Such reporting may include assumptions regarding the impact of interest rate hedges established by borrowers to reduce their exposure to floating interest rates (resulting in a reduced hedging rate being used for the total interest expense in respect of such hedges, rather than any higher rates applicable under the documentation for such loans), even if such hedging instruments are not pledged as collateral to lenders in respect of such loans and do not secure the loans themselves. The interest rate coverage ratio excludes junior capital investments and equity co investments, and applies solely to traditional middle market first lien loans held by NCDL, which also excludes any upper middle market or other first lien loans investments that do not have maintenance financial covenants, and first lien loans that the Adviser has assigned a risk rating of 8 or higher, as well as any portfolio companies with net senior leverage of 15 x or greater. As a result of the foregoing exclusions, the interest coverage ratio shown herein applies to 74.10% of our total investments, and 85.22% of our total first lien loan investments, in each case based upon fair value as of December 31, 2023. 14 Regular Distribution Yield is the Regular Distribution per share declared in respect of the quarter, divided by the NAV per share as of the respective quarter end, annualized. 15 Supplemental Distribution Yield is the Supplemental Distribution per share declared in respect of the quarter, divided by the NAV per share as of the respective quarter end, annualized. 16 Special Distribution Yield is the Special Distribution per share declared in respect of the quarter, divided by the NAV per share as of the respective quarter end. 17 The Total Distribution Yield presented is the sum of the Regular Distribution per share and Supplemental Distribution per share (if any), annualized on a quarterly basis, plus any Special Distributions per share. Given the nature of Special Distributions, certain Special Distributions may be presented on a non- annualized basis. 18 The per share data was derived by using the weighted average shares outstanding for the three months ended December 31, 2023. 19 The per share data for distributions reflects the actual amount of distributions declared for the three months ended December 31, 2023. 20 Includes the impact of different share amounts used in calculating per share data as a result of calculating certain per share data based on weighted average shares outstanding during the period and certain per share data based on shares outstanding as of a period end or transaction date. 21 Represents the par amount of total new investment activity for the three months ended December 31, 2023. Investment activity does not include draws on existing Delayed Draw Term Loans and partial paydowns. 22 Average Spread is calculated based off of par amount. 23 Average Coupon is calculated based off of par amount. Average coupon includes 68% cash coupon and 32% PIK. 24 Interest rate utilizes the floating rate investment spread plus the greater of 3-Month base rate, or base rate floor, if applicable for each respective transaction (SOFR as of March 31, 2023 was 4.91%, LIBOR as of March 31, 2023 was 5.19%; SOFR as of June 30, 2023 was 5.27%, LIBOR as of June 30, 2023 was 5.55%; SOFR as of September 30, 2023 was 5.40%; SOFR as of December 31, 2023 was 5.33%). 25 Average Position Size (at fair value) is calculated as a percentage of Total Portfolio (at fair value) divided by Committed Capital. Committed Capital includes Equity Commitment of $906M as of December 31, 2023 and $1,167M from Financing Facilities. Endnotes
21Nuveen Churchill Direct Lending Corp. Note: All information is as of December 31, 2023, unless otherwise noted. Numbers may not sum due to rounding. 26 36% of first lien term loans are unitranche positions. 27 Net Interest Margin calculated as Weighted Average Yield on Debt and Income Producing Investments at Fair Value minus Average Cost of Debt. 28 Average Interest Rate includes borrowing interest expense and unused fees. 29 Interest rates represent the weighted average spread over 3-month SOFR for the various floating rate tranches of issued notes within the CLO. The weighted average interest rate for the CLO excludes tranches with a fixed interest rate. 30 The Corporate Revolver is defined as the Revolving Credit Facility in the Company's Annual Report on Form 10-K for the year ended December 31, 2023. 31 Weighted average facility pricing spread weighted based on total commitment amount. SOFR base rate tenors may differ between credit facilities. 32 Represents a special/supplemental dividend. Endnotes